Back to Blogs
August 10th, 2026
Why Fleet Route Optimization Is Critical When School Traffic Returns


Categories
For most of the summer, service fleet route optimization is a solved problem, until school is back in session. During early summer, school lots sit empty, the morning traffic flow is light, and the stop sequence your dispatcher built in June still holds up into the third week of July.
Then a Tuesday in mid-August arrives, and every assumption inside that plan expire all at once.
This doesn’t happen on a single national date, either. Pew Research Center’s analysis of school district calendars found that the most common school start dates cluster in the second and third full weeks of August — but in the West South Central states, 94% of students go back during a single 12-day stretch in early August, while about three-quarters of students in New Jersey, New York, and Pennsylvania don’t return until after Labor Day. If you run field service crews across regions, your morning peak doesn’t shift just one time, it shifts four or five times over six weeks, region by region, and your planned routes absorb every one of those shifts whether you modeled them in or not.
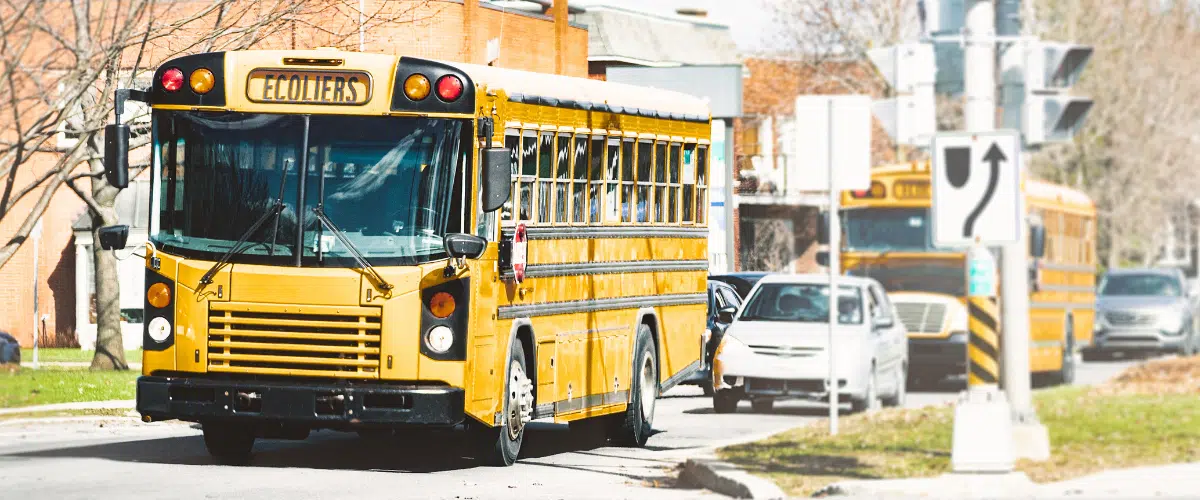
Meanwhile the traffic volume itself is bigger than many fleet managers assume. NHTSA reports that nearly 500,000 school buses carry more than 25 million students to and from school every day. Every one of those buses makes frequent, unpredictable, legally protected stops on the exact arteries that your drivers use.
This is the case for treating fleet route optimization as an August operating requirement rather than a nice-to-have. Let’s break down what actually changes, what it costs, how route optimization works, and what to look for in route optimization software before the first bell rings.
The School Calendar Your Fleet Route Optimization Plan Doesn’t Know About
Manual planning fails in August for a specific reason: the constraint that changed is not visible in the data that your dispatcher is looking at.
A spreadsheet of stops and a map do not contain bell schedules. They don’t know that the road that your driver takes at 7:40 a.m. runs past two elementary schools with a combined 900 students arriving by car. They don’t know that a stretch of road with a 45 mph limit in July becomes a 20 mph enforced school zone in August. And they certainly don’t know that the same route, driven in the same sequence, now takes 14 minutes longer — every single morning, for the next nine months.
The scale of the disruption is not subtle. The National Association of State Directors of Pupil Transportation Services runs an annual national survey in which school bus drivers count how many vehicles illegally pass their stopped buses on a single day, then scales that count across the school year. Recent projections run into the tens of millions of violations annually. Treat those as projections rather than a census — but note what the underlying count measures. Every one of those events is a bus stopped in a live traffic lane with its stop arm out, which means the survey is also a rough index of how often through traffic is being brought to a complete halt during the morning and afternoon peaks.
Your July route plan was optimized against a road network that no longer exists. Inefficient routes in August are not a planning oversight. They are a forecast that went stale on a published date that you could have looked up.
Two Windows That Should Reshape Your Whole Day

Here is the finding that should govern how you sequence stops in August, and it comes straight out of federal crash data.
In its June 2025 fact sheet on school-transportation-related crashes, NHTSA’s National Center for Statistics and Analysis reports that from 2014 to 2023, more school-age pedestrians were killed from 7:00 to 7:59 a.m. and from 3:00 to 3:59 p.m. than during any other hours of the day.
Two one-hour windows. Not a vague “school season” risk — two specific hours, repeating daily, that are also the two hours your field service crews are trying to hit their first and last appointments.
The rest of the data set dismantles a comfortable assumption. Over the same ten years there were 971 fatal school-transportation-related crashes and 1,079 people killed, an average of 108 per year.
Most of the people killed — 70% — were occupants of other vehicles, not the occupants of the bus. There were 1.5 times more pedestrian fatalities (171) than school transportation vehicle occupant fatalities (113). Of the 209 school-age children who died, 79 were pedestrians, and about half of the school-age pedestrians killed were between 5 and 10 years old.
Read that again as a fleet manager. In crashes that involve school transportation, the bus is rarely where the deaths happen. The other vehicles on the road are. In August, your fleet vehicles are the other vehicles on the road.
The broader pedestrian picture is finally improving, and it still isn’t good. Preliminary data from state highway safety offices, compiled by the Governors Highway Safety Association, shows that drivers struck and killed 6,732 people walking in the U.S. in 2025 — down 7% and the third straight annual decline, but still 5% above the pre-pandemic level. Progress on a trend line still doesn’t protect you on a busy Tuesday morning.
On top of that, August has a second risk layer that many fleets never connect to the first. AAA’s crash analysis shows that 13,135 people were killed in crashes involving a teen driver between 2019 and 2023, with more than 30% of deaths falling inside the “100 Deadliest Days” between Memorial Day and Labor Day — an average of 8 deaths per day in summer versus 7 during the rest of the year. That window does not close when school opens. It closes at Labor Day. For two to four weeks, depending on your region, back-to-school traffic and peak teen-driver risk are stacked on top of each other on the same roads.
Fleet route optimization cannot make other drivers safer. What it can do is decide how many of your vehicles are inside a school zone at 7:30 a.m. and 3:15 p.m., and that is a decision many fleets are currently making by accident.
August Math on Fuel Costs and Time
The safety case is the one that should motivate you. The financial case is the one that gets the budget approved.
Start with what fuel costs right now. As of July 27, 2026, the EIA put the U.S. average on-highway diesel price at $5.313 per gallon — up $1.508 from a year earlier — with unleaded gasoline at $4.096 per gallon, up $0.973 year over year. That is roughly a 40% jump in diesel and a 31% jump in unleaded gasoline in twelve months. Rising fuel costs re-priced every wasted mile and every minute of avoidable idling in your operation, and the increase landed weeks before the school-year traffic pattern arrives.
That matters because idling is where school-zone traffic congestion costs you. The Department of Energy’s Alternative Fuels Data Center reports that more than 6 billion gallons of gasoline and diesel are lost to idling in the U.S. every year — a figure DOE prices at more than $11 billion at $2 per gallon. Diesel today costs more than two and a half times that benchmark. The waste didn’t grow, but the costs did.

Now, let’s run it against a fleet’s operation. Argonne National Laboratory’s analysis of idling reduction economics for long-haul trucks models idling fuel consumption at 0.8 gallons per hour — a heavy-duty fleet assumption, so treat it as the upper bound for a mixed fleet of medium duty vans and trucks. Suppose that school-zone queuing and stop-arm delays add just 20 extra idle minutes per vehicle per school day. Across a 40-vehicle fleet over a 180-day school year, that is about 1,900 gallons, or roughly $10,200 in fuel burned while idling in traffic at today’s fuel prices. No miles driven. No jobs completed. No revenue attached. That is the single easiest line item to attack with better route planning.
Congestion at industry scale tells the same story with more zeros. The American Transportation Research Institute found that highway congestion added $108.8 billion in costs to the trucking industry in 2022, a 15% year-over-year increase, including 6.4 billion gallons of wasted diesel and $32.1 billion in added fuel cost. Per truck, that came to $7,588 — the equivalent of more than 430,000 commercial drivers sitting idle for a full work year.
Traffic congestion is still climbing, too. INRIX’s 2025 Global Traffic Scorecard reported that congestion increased in 254 of the 290 U.S. cities analyzed, with Chicago drivers losing 112 hours, New York 102, and Philadelphia 101.
Inefficient routes were expensive in 2024. In August 2026 they are the most expensive they have ever been, which makes fleet route optimization one of the few cost control levers you can still pull without cutting headcount.
How Fleet Route Optimization Works
Before the evaluation criteria, it helps to understand what route optimization software does between “Here are today’s jobs.” and “Here is each driver’s plan.” Route planning software runs four steps, and each one is a place where accuracy is either created or lost.
1. Pinning Every Stop to the Right Spot on the Map
First, the software turns each address on your job list into map coordinates. How precisely it does that matters.
Weaker systems drop the pin in the middle of the street or the middle of the block rather than on the specific building. Your driver could arrive on the wrong side of a divided road, facing four lanes of traffic with no legal turn. In June that costs two minutes. On a school corridor at 3:15 p.m., it costs fifteen minutes and a missed arrival window.
Bad address data never announces itself. It just quietly adds time to the same stops, every single day.
2. Working Out Who Goes Where, and in What Order
Next, the software decides which vehicle takes which stops and the order each driver drives them.
This is a far harder question than the one that a phone navigation app can answer. Finding the shortest path between two points is simple arithmetic. Splitting several hundred stops across multiple vehicles and then sequencing every one of those routes is what researchers call the vehicle routing problem, and for a real fleet the number of possible combinations runs into the trillions.
That is why manual planning tops out at “good enough.” A dispatcher with a map and a spreadsheet will find a workable route, but rarely the best one — there just isn’t enough time in the morning to check the alternatives. Route planning software evaluates an enormous number of options in seconds and returns the best routes it can find, which are frequently not the shortest ones.
3. Applying Your Real Operating Rules
Optimal routes that break your operating rules are worthless, so the plan has to respect the constraints that your day carries: delivery time windows, how long each stop really takes, which drivers are qualified, and driver shift limits.
For example, if route planning software can support time windows, a technician can arrive in a specific time slot and dispatchers can assign routes to drivers based on their work hours and skill sets.
4. Getting the Plan to Drivers and Watching It Play Out
Finally, the finished plan reaches the driver’s phone a a multi-stop route and status updates come back to the web portal as each stop is closed out.
That last part closes the loop. Dispatch can see live vehicle locations against the plan, which is what makes adjusting routes mid-day a real option instead of a theoretical one.
Skip any of the four and you don’t have route optimization. You have a nicer-looking list of stops.
Five Jobs Fleet Route Optimization Software Has to Do in August Traffic
A routing tool that only finds the shortest path is not optimization software. It’s a map. Once school is back, well-planned routes have to do five distinct jobs at once.
1. Sequencing Stops Around the Bell
The shortest path and the best route are different objects. A sequence that looks optimal based on distance can route three vehicles past the same elementary school at 3:10 p.m.
Real optimization engines treat delivery time windows as hard constraints and solve for arrival. Good planning software includes prioritizing on-time arrival and minimizing the number of vehicles needed — not simply shrinking total distance. The practical August move is to treat the 7 a.m. and 3 p.m. hours as windows to route around, then let the tool re-sequence everything else to absorb it.
2. Respecting Service Times, and Driver Shift Limits
August compresses your day, which means every other constraint tightens at the same time.
This is where manual planning breaks first. A dispatcher rearranging the order of stops on a spreadsheet has no way to see that an extra quarter hour each morning has quietly pushed a driver past their shift limit into overtime — or, for regulated fleets, toward an hours-of-service violation. Driver schedules, driver availability, and service times are all constraints on the same day. The fleets that stay out of trouble in August are the ones where routing, timekeeping, and hours data are visible in one place instead of in three.
3. Real-Time Fleet Route Optimization When the Plan Breaks
Real-time route optimization means the plan can change after it has been dispatched — when a stop-arm delay, a closed school-zone lane, or an emergency job dropped into a full afternoon makes the morning’s sequence wrong. The test is whether your dispatcher can modify routes mid-day and push the change to the driver in seconds, or whether the plan is effectively frozen the moment it leaves the office.
Traffic data quality is the other half of it. Many advanced mapping systems will include predictive traffic congestion when optimizing routes. Even though accurate traffic costs more to compute, in an August school zone, so does guessing.
4. Real-Time Visibility on Vehicle Locations
Live vehicle locations on a single map are what convert a re-optimization capability into an actual dispatch decision — which driver is closest, which is already behind, and which one is three blocks from a school that releases students in ten minutes.
This is also where routing stops acting as a standalone routing and dispatching tool and becomes a real fleet management platform. Route data, GPS position, and driver behavior belong in one platform, because the same afternoon congestion that wrecks your tech’s performance metrics produces the harsh braking events you’ll be coaching next month.
5. Turning Accurate Arrival Times Into Customer Communication
Growing customer expectations are not slowing down to accommodate your school-traffic problem. The Census Bureau estimated that Q1 2026 e-commerce sales at $327.6 billon — 16.9% of all retail sales and up 9.8% year over year. Every quarter of that growth trains your customers to expect a tracked, narrow, accurate delivery window, especially for a service businesses that are dispatching technicians.
Optimized routes produce arrival times precise enough to send an alert to your customers such as “Your technician will arrive between 2:15 and 2:45” . This is a service quality claim that you can only make if the plan underneath it accounts for the school zone between stop four and stop five.
Key Benefits of Fleet Route Optimization, and the Metrics That Prove Them
The key benefits of fleet route optimization are quantifiable, so tie each one to a number that you already track. If you cannot see movement in these key metrics within a quarter, the tool might not be working correctly.
| Aspect | What Changes | Metric to Watch |
| Fuel | Fewer miles, less idling | Gallons per stop; idle minutes per vehicle per day |
| Vehicles | Reduced vehicle wear from fewer miles and gentler driving | Maintenance cost per mile; unplanned downtime events |
| Labor | Higher driver productivity inside the same shift | Stops completed per driver per day; overtime hours |
| Assets | Better vehicle utilization across the fleet | Jobs per vehicle; vehicles required to cover the day |
| Customers | Improved delivery performance and customer satisfaction | On-time arrival rate; “Where is my driver?” call volume |
A few of these deserve a little more detail than what is shown in the table.
Reduce fuel consumption first, because it is the fastest to verify. More efficient routes can cut both distance and time-in-traffic, and at $4.01 per gallon the savings are realized quickly. This is also a benefit that is closely tied to August traffic: the same plan that was efficient in July burns measurably more fuel once school-zone queuing starts.
Vehicle wear is the benefit that fleets often forget to claim. Fewer miles means fewer brake jobs, fewer tires, and longer intervals between services. It shows up as fleet efficiency savings within two budget cycles, which is why it rarely makes the business case even though it belongs there.
Driver productivity is not about driving faster. It is about converting windshield time into completed jobs. When you plan efficient routes, the hours that drivers spend between stops shrink and the day’s capacity grows without adding a vehicle or additional headcount — the definition of operational efficiency in a fleet operation.
Customer satisfaction is a downstream result. Accurate arrival times are only possible when based on a plan that factors in real-time traffic. That is the connection many fleets miss: service quality is a routing output, not a customer-service function.
Together these are what modern fleet operations mean when they talk about using data to maximize efficiency rather than simply working longer days.
Static Planning vs. Real-Time Fleet Route Optimization
If you are able to take away one reason why real-time routing matters more in August than in July, it is this…
A December 2025 study in Scientific Reports on urban last mile delivery benchmarked dynamic fleet route optimization against static routing across modeled urban traffic conditions. The dynamic approach produced a 24.3% reduction in total operational cost, cut congestion exposure by 54.4%, and raised on-time delivery rates from 68.1% to 92.8%
However, the finding that should reshape how you buy is included in the details: under extreme traffic conditions, the dynamic method limited performance degradation to 15.1%, compared with 26.2% in static systems
The advantage of real-time re-optimization is not constant. It widens precisely when traffic gets worst — which is to say, it widens exactly in the weeks when school starts. A routing system evaluated on a quiet Tuesday in July will look far more adequate than it actually is.
Data Quality Problem Nobody Wants to Own
Optimization engines are only as good as three unglamorous data sets. First, geocoding, for the reason described above. Second, service times: if your model assumes 20 minutes per stop and your techs actually spend 35, every downstream time window in the plan will be missed.
If you audit data quality in the last week of July, you will get a working plan in August.


Choosing the Right Fleet Route Optimization Software
If you are comparing route optimization tools now, the August pattern gives you a sharper test than any generic feature list. These are the key features to require of your potential providers:
- Time to build a day’s routes. If planning tomorrow still takes a dispatcher close to an hour, the tool will get abandoned in the first busy week of September. You want them to be able to build routes in minutes.
- Mid-day modification. When an emergency job lands at 1 p.m., can the dispatcher rework the affected routes and get the change onto the driver’s phone immediately — or is the current day’s plan unchangeable?
- Traffic awareness. Does it plan around congested corridors at the time of day the driver will actually be there, or flatten a 3 p.m. school peak traffic period into a daily average?
- Driver-side usability. Can you send multi-stop routes in their optimized order with the addresses, contacts, and job instructions all on one screen. Can the techs make one-tap status updates and capture photos or signatures at job close-out? Or is it sent to the tech as a PDF that they will likely ignore?
- Customer-facing output. Can it send arrival times to the customer automatically when the driver is en route, or are ETA requests left up to whoever answers the phone in your office?
- Integration with your own systems. Do routes, live vehicle locations, driver behavior, and inspection data land in one platform alongside the rest of your fleet management stack, or as four disconnected tools?
A demo run against your own worst August route tells you more than any published benchmark.
Documentation Is Defense
There is one more reason to formalize this before the first bell, which has nothing to do with fuel.
If one of your vehicles is involved in a collision in a school zone during the 7 a.m. or 3 p.m. window, the question in discovery will not be whether your driver was speeding. It will be what your company knew about the risk and what it did about it. A documented routing policy — school-zone avoidance during posted hours, time windows built around bell schedules, an auditable record of the planned routes each driver was given and why — demonstrates that a fleet that took its duty of care seriously. The absence of this evidence in a case involving a child tells a jury a very different story. This is the same logic that drives nuclear verdicts in ordinary commercial vehicle cases, applied to a risk that appears on your calendar every August. It is entirely foreseeable.
Window Closes When the First Bell Rings
Rebuild your route plans in the last two weeks of July and August becomes an ordinary month.
Ignore the difference between these two months and you will find out what’s broken the expensive way — one missed service window and one angry customer at a time. August is the worst possible month to be learning it. Traffic is at its heaviest, children are crossing your routes twice a day, and fuel is $4.01 a gallon.
Our advise is to:
- Pull the start dates for every district in your operating territory and mark them on your dispatch calendar by region.
- Identify every school zone on your top 20 routes and the posted hours that apply to each.
- Treat 7:00–7:59 a.m. and 3:00–3:59 p.m. as constrained time windows in your fleet route optimization model, not as ordinary road time.
- Audit geocoding accuracy and service times before new plans get built on top of them.
- Verify that your route planning software can re-optimize in real time — and test it on your worst corridor, not your easiest one.
- Baseline your key metrics now, so the fuel, driver productivity, and delivery performance gains are measurable in September.
- Document the policy, the routes, and the reasoning, and keep the record.
None of this makes August traffic disappear, but it decides whether your fleet absorbs it as a plan or as a series of surprises.
Ready to Rebuild Your Routes Before the School Year Starts?
Back-to-school traffic is the most predictable disruption on a fleet’s calendar, and it is the one many operations still handle reactively.
FieldLogix built the Goose© app for exactly this problem. It turns a routing process that used to take hours into one that takes minutes, plans routes around congested corridors so drivers aren’t sitting in school traffic, and lets dispatchers modify routes mid-day when the morning’s plan goes out the window. Techs get their stops in an optimized order with the address, customer contact details, and job instructions on one screen. They can update job statuses as they close each one and capture photos and signatures as proof of service. Customers get an estimated arrival time automatically when the driver is en route.
Because Goose is included in the FieldLogix platform, which also includes GPS fleet tracking, the routes, live vehicle locations, and driver behavior monitoring details all live in one place.
The buses are already being cleaned. The start dates are already published. Do your routes reflect them? See how Goose routing and dispatching works and get your route plans rebuilt before the first bell rings.